API Overview
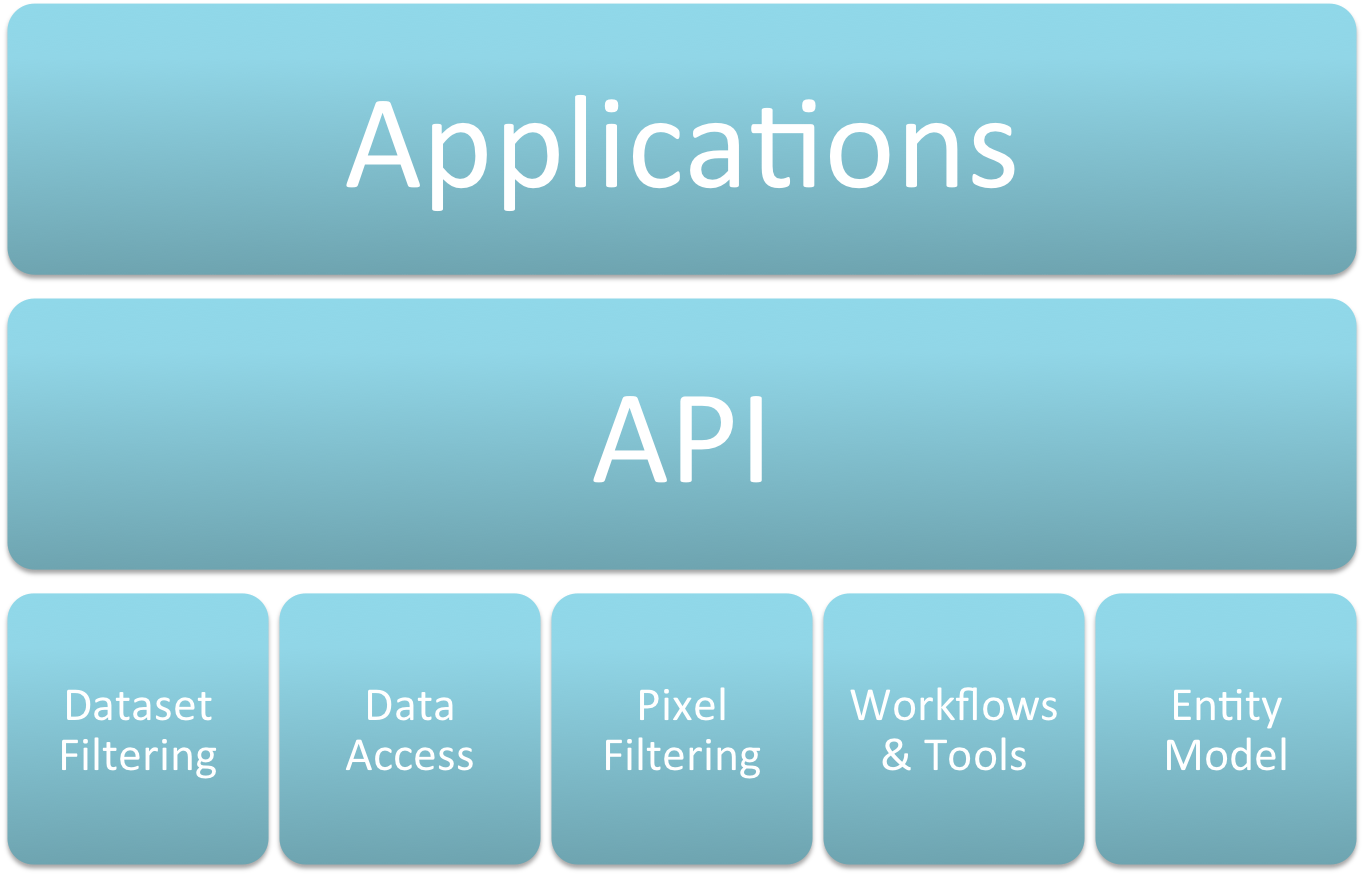
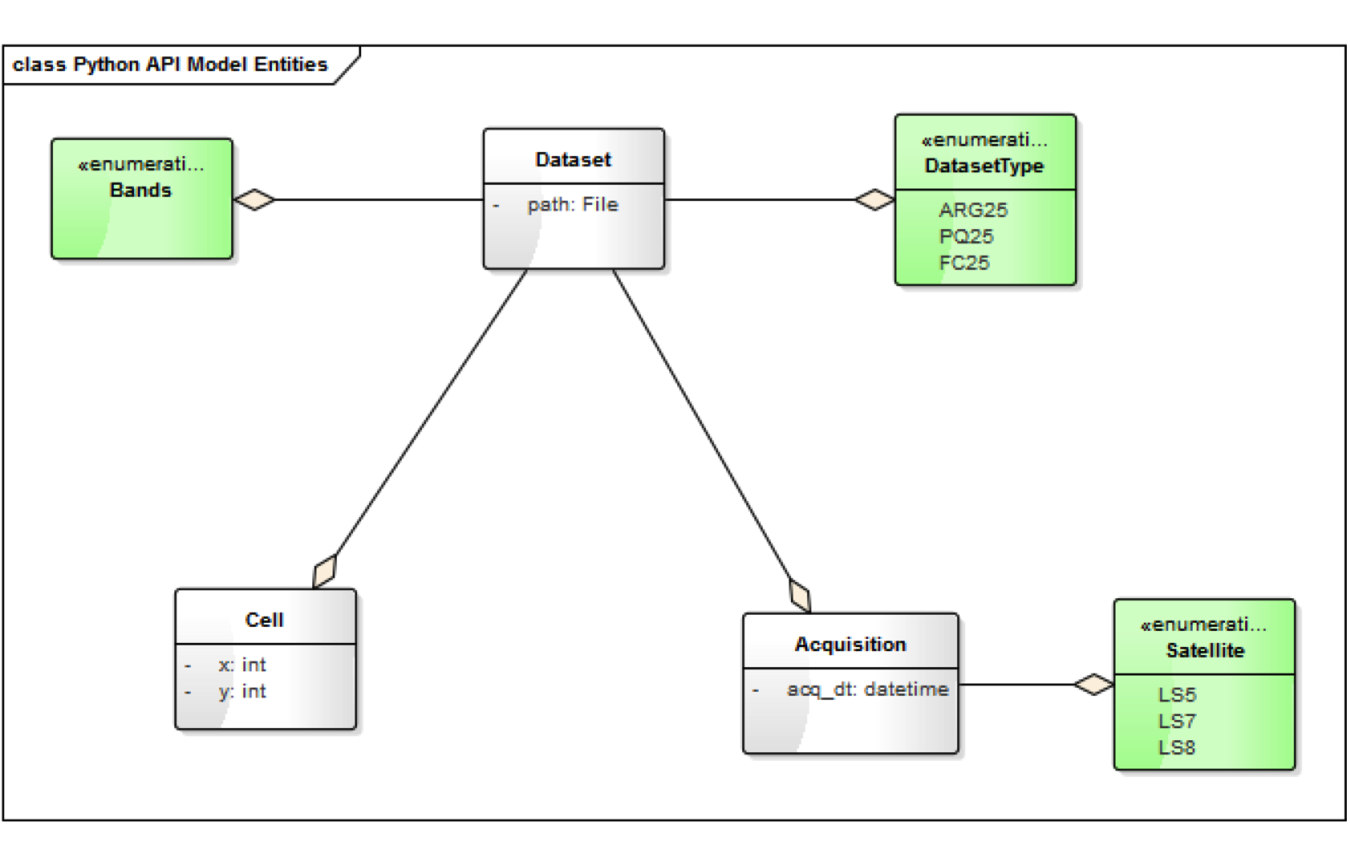
Model Entities
Dataset Filtering (aka Querying)…
- List cells or datasets
- List present or missing
- Spatial criteria – x/y or region/AOI (WKT/WKB directly or from vector file)
- DB result set or (to) CSV
- NBAR, PQA, FC, DSM/DEM
- WOFS – currently “fudged” until ingested
- Virtual datasets (NDVI, EVI, Tassel Cap, NBR, …)
List Cells
List cells for which we DO have matching datasets…
For e.g. LS8 acquired in 2014 for which we DO have NBAR, PQA and DSM…:
list_cells(x=range(120, 125), y=[-20],
           acq_min=datetime(2014,1,1),
           acq_max=datetime(2014,12,1),
           satellites=[LS8], dataset_types=[ARG25, PQ25, DSM])

(120, -20)
(121, -20)
(122, -20)
(123, -20)
(124, -20)
List cells for which we have DON’T have matching datasets….
For e.g. LS8 acquired in 2014 for which we don’t have FC…:
list_cells_missing(x=range(120, 125), y=[-20],
                   acq_min=datetime(2014, 01, 01),
                   acq_max=datetime(2014, 12, 31),
                   satellites=[LS8], dataset_types=[FC25])

(121, -20)
(122, -20)
(123, -20)
List Datasets
List matching datasets…
For e.g. LS8 acquired in Q1 of 2014 for which we DO have NBAR, PQA and DSM datasets…:
list_datasets(x=range(120, 125), y=[-20],
              acq_min=datetime(2014,1,1),
              acq_max=datetime(2014,3,31),
              satellites=[LS8], dataset_types=[ARG25, PQ25, DSM])

(120, -20) 2014-01-10 02:03:44 /g/data/… /g/data/… /g/data/…
           …
           2014-03-31 02:02:42 /g/data/… /g/data/… /g/data/…

(121, -20) 2014-02-04 01:57:19 /g/data/… /g/data/… /g/data/…
           …
           2014-02-13 01:50:34 /g/data/… /g/data/… /g/data/…

(123, -20) 2014-02-13 01:50:34 /g/data/… /g/data/… /g/data/…
List missing datasets…
For e.g. LS8 acquired in 2014 for which we don’t have FC…:
list_datasets_missing(x=range(120, 125), y=[-20],
                      acq_min=datetime(2014,1,1),
                      acq_max=datetime(2014,3,31),
                      satellites=[LS8], dataset_types=[FC25])

(120, -20) 2014-01-10 02:03:44 /g/data/…/LS8_NBAR…
           …
           2014-03-31 02:02:42 /g/data/…/LS8_NBAR…

(121, -20) 2014-02-04 01:57:19 /g/data/…/LS8_NBAR…
           …
           2014-02-13 01:50:34 /g/data/…/LS8_NBAR…

(123, -20) 2014-02-13 01:50:34 /g/data/…/LS8_NBAR…
List ... by AOI…
The same but WKT or vector file rather than x/y range…:
list_cells_wkt(wkt=“POLYGON(…)”, …)
list_cells_vector_file(file=, layer=, feature=, …)

list_datasets_wkt(wkt=“POLYGON(…)”, …)
list_datasets_vector_file(file=, layer=, feature=, …)

…
List … to CSV…
The same but “_to_csv”…:
list_cells_to_csv(x, y, …, filename)
list_cells_missing_to_csv(x, y, …, filename)

list_datasets_to_csv(x, y, …, filename)
list_datasets_missing_to_csv(x, y, …, filename)

…
Data Access
You provide a “dataset” (e.g. from a list query) and you get back numpy array(s)
All data or some data – subset by band, space or both:
# all data in all bands
get_dataset_data(datasets[ARG25])

# all data in RED & GREEN bands
get_dataset_data(datasets[ARG25], bands=[RED, GREEN])

# 50x50 pixels starting at (100, 100) in RED & GREEN bands
get_dataset_data(datasets[ARG25], bands=[RED, GREEN], 100, 100, 50, 50)
Physical datasets – NBAR, PQA, FC, DSM, WOFS, …
Virtual datasets – NDVI, EVI, NBR, Tassel Cap, …. Behind the scenes, a virtual dataset points at (a currently SINGLE) physical dataset…:
# all data in all bands in dataset
get_dataset_data(datasets[NDVI])

# all data in all bands in dataset
get_dataset_data(datasets[TCI])

# 50x50 pixels starting at (100, 100)
get_dataset_data(datasets[NDVI], 100, 100, 50, 50)
In future “bring your own datasets”
For e.g. ability to treat your own (intermediate) outputs as fully fledged data cube datasets
Maybe – haven’t thought my way through all the how’s and why’s of this yet…
Pixel Filtering (aka Masking)
- Replaces pixel value with NDV
- PQA
- WOFS
- NDVI
- Range of values
- AOI
PQA, WOFS, masking…
Get FC data with non-clear and water pixels masked out…:
mask = None

mask = get_mask_pqa(datasets[PQ25], [PQA_MASK_CLEAR], mask)
mask = get_mask_wofs(datasets[WATER], [WATER], mask)

data = get_dataset_data_masked(datasets[FC25], mask, NDV)
Value range masking…
Get FC data with additional masking for values outside 10% - 80% bare soil range…:
mask = None

mask = get_mask_pqa(datasets[PQ25], [PQA_MASK_CLEAR], mask)
mask = get_mask_wofs(datasets[WATER], [WATER], mask)

data = get_dataset_data_masked(datasets[FC25], mask, NDV)

mask = get_mask_range(data[BARE_SOIL], 1000, 8000, mask)

data = apply_mask(data, mask)
NDVI Value range masking…
Get FC data with additional masking for NDVI values outside 0 to 0.3 range…:
mask = None

mask = get_mask_pqa(datasets[PQ25], [PQA_MASK_CLEAR], mask)
mask = get_mask_wofs(datasets[WATER], [WATER], mask)

data = get_dataset_data_masked(datasets[FC25], mask, NDV)

mask = get_mask_range(data[BARE_SOIL], 1000, 8000, mask)

mask = get_mask_range(datasets[NDVI], 0.0, 0.3, mask)

data = apply_mask(data, mask)
AOI masking…
Apply an AOI mask…:
mask = None

mask = create_aoi_mask_for_cell(file=, layer=, feature=, x=, y=)

data = get_dataset_data_masked(datasets[FC25], mask, NDV)
AOI masking – An ACTual example…
Lets do some analysis on surface reflectance with an AOI of the ACT…
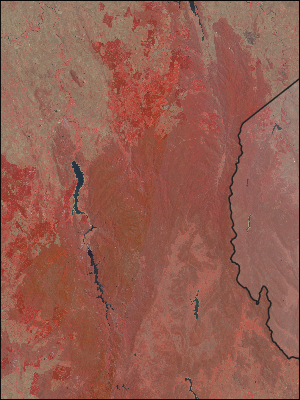
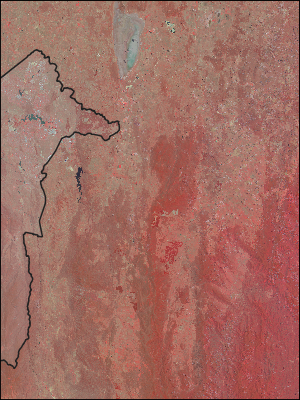
Start with the AGDC surface reflectance data…
…and AOI in a vector (shape, KML, etc) file…
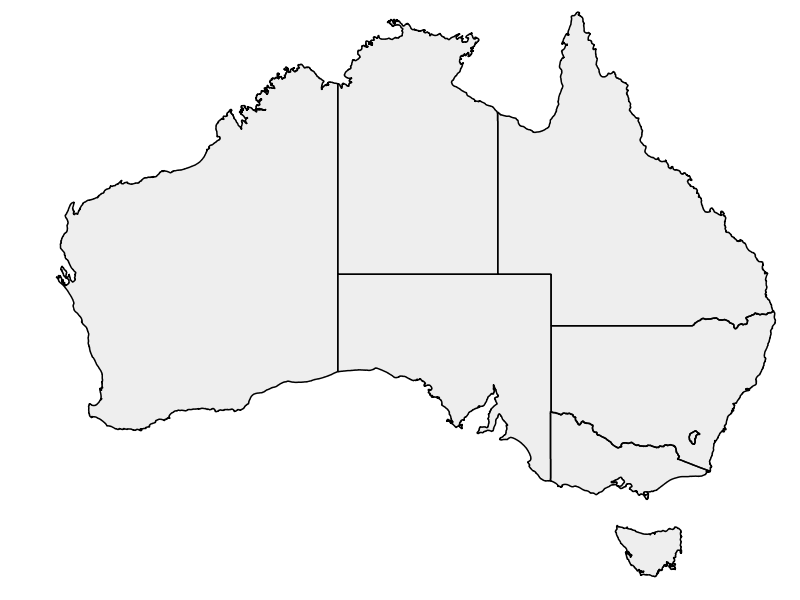
…and let’s focus in on the ACT…
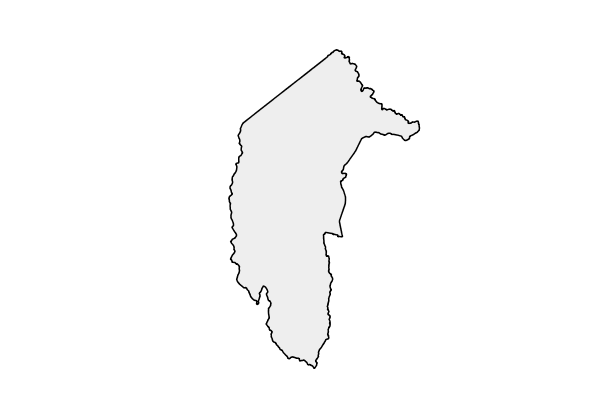
…find the CELLs that cover the ACT…:
list_cells_vector_file(file=“australian_states.shp”,
                       layer=“australian_states”,
                       feature=4, …)

(148, -36)
(149, -36)
…grab some NBAR datasets for those cells (148/-36 & 149/-36) from the cube…:
for dataset in list_datasets_vector_file(file=“australian_states.shp”,
                                         layer=“australian_states”,
                                         feature=4, …):

    get_dataset_data(datasets[ARG25])
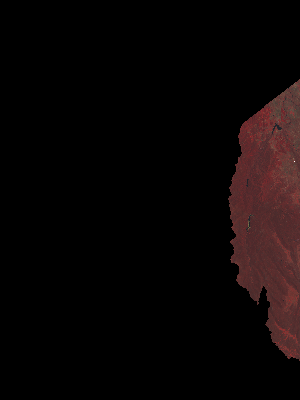
…which gives us…
…and then adding in AOI masking…:
for cell in list_cells_vector_file(file=“australian_states.shp”,
                                   layer=“australian_states”,
                                   feature=4, …):

    mask = None

    mask = create_aoi_mask_for_cell(file=“australian_states.shp”,
                                    layer=“australian_states”,
                                    feature=4,
                                    x=cell.x, y=cell.y)

    data = get_dataset_data_masked(datasets[ARG25], mask, NDV)
…which gives us…
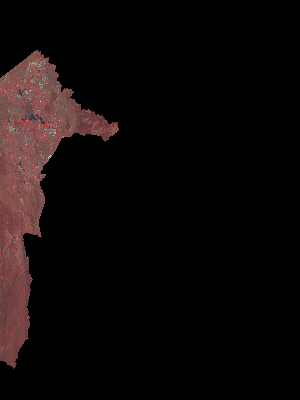
…and maybe mosaic them together…
…and apply your favourite analysis formula(ae)…
Workflows
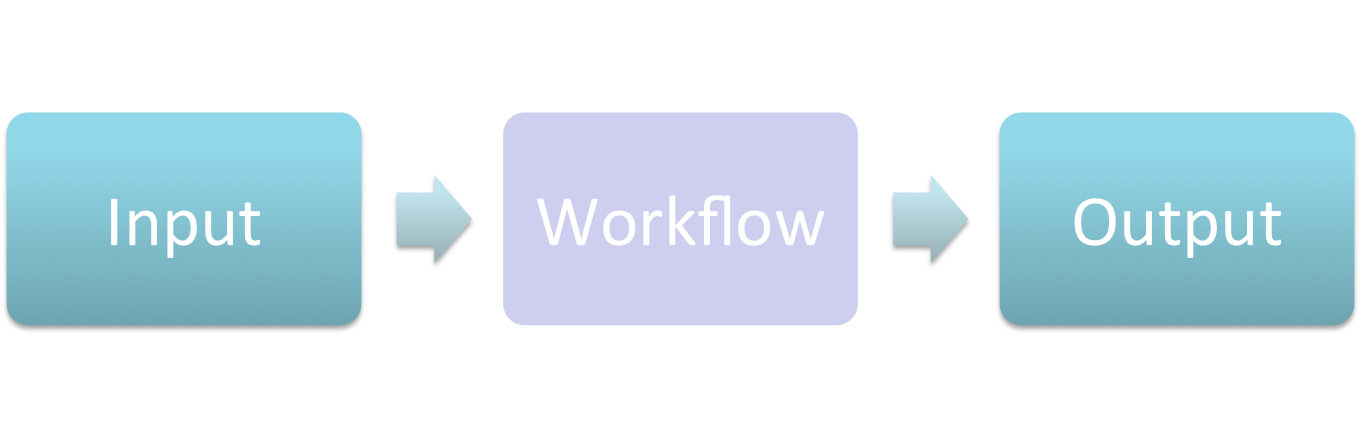
A workflow:
- takes input(s);
- does “stuff”; which
- turns the inputs into output(s)…
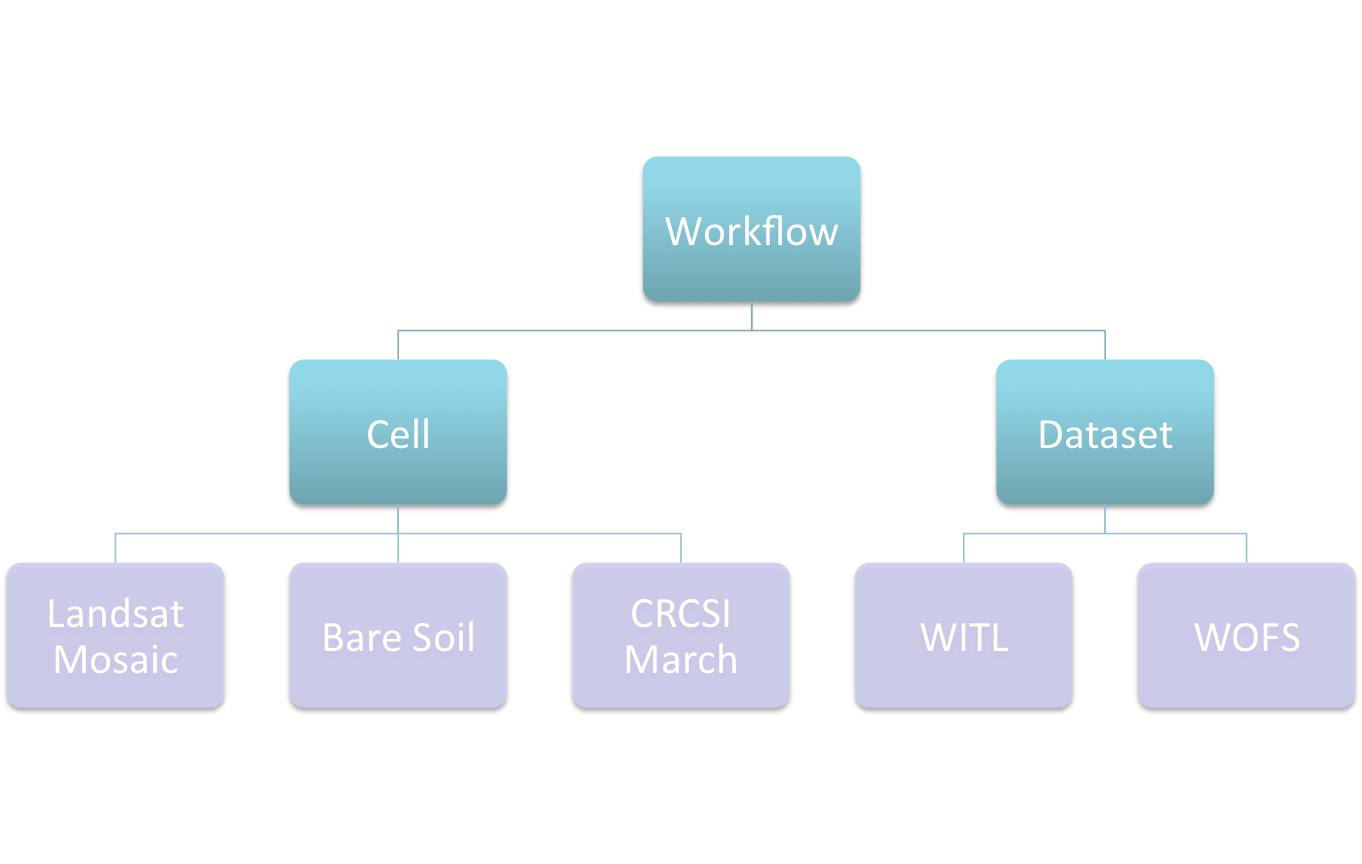
Have been driven by the applications:
- Landsat Clean Pixel Mosaic
- Bare Soil
- Wetness in the Landscape
- CRCSI March (Adam’s version(s))
- CRCSI March (Leo’s version(s))
- WOFS
- …
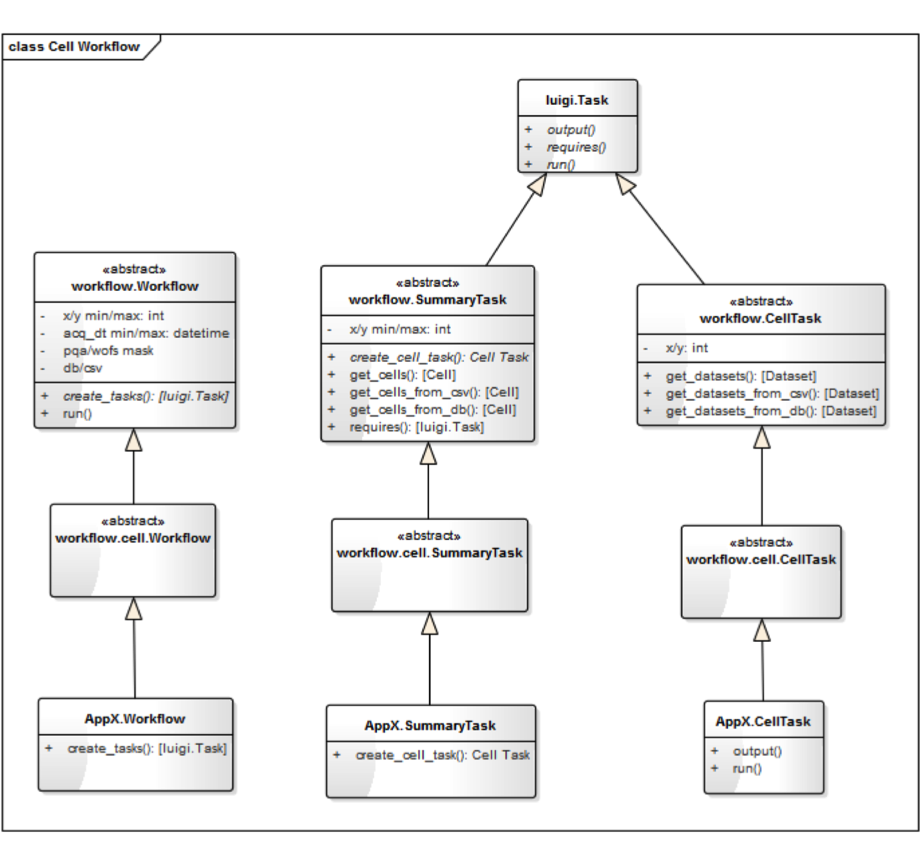
Cell Based Workflows…

PQA Observation Count Example…
To help validate/improve the PQA algorithm more information about the PQA outputs was desired
For e.g. for each pixel show how many times it was:
- Observed (in total and “clearly” as per PQA)
- Classified as “unclear” on the basis of each of the PQA flags (contiguity, saturation, cloud, cloud shadow, …)
So get an output raster for each cell with a band representing each of the above
This is a Cell workflow:
- Extend the abstract cell workflow with:
ObservationCountWorkflowwhich extendscell.WorkflowObservationCountSummaryTaskwhich extendscell.SummaryTaskObservationCountCellTaskwhich extendscell.CellTask
ObservationCountWorkflow…¶class ObservationCountWorkflow(cell.Workflow):
def create_tasks(self):
return [ObservationCountSummaryTask(x_min=, x_max=, …)]
ObservationCountSummaryTask…¶class ObservationCountSummaryTask(cell.SummaryTask):
def create_cell_task(self):
return [ObservationCountCellTask(x=, y=, …)]
ObservationCountCellTask…¶class ObservationCountCellTask(cell.CellTask):
def output(self):
return LocalTarget(“{satellite}_OBS_{x}_{y}_{acq_min}_{acq_max}.tif”
def run(self):
[obs_count[b] = empty_array() for b in [TOTAL CLEAR CONTIGUITY …]]
for tile in self.get_tiles():
data = get_dataset_data(datasets[PQ25])
obs_count[TOTAL] += 1
for mask in [CLEAR CONTIGUITY … CLOUD CLOUD_SHADOW …]:
obs_count[mask] += numpy.where(data == mask, 1, 0)
raster_create(self.output().path, data=obs_count,…)
Cell Chunk Based Workflows…
Process a cell in manageable chunks…
Cell Dataset Band Based Workflows…
Process a dataset / dataset band…
Cell Dataset Band Chunk Based Workflows…
Process a dataset / dataset band in manageable chunks…
Band Stack Workflow…
The Band Stack workflow is a specific instance of the Cell Dataset Band workflow which produces a set of band stack outputs. It can be run as a stand-alone workflow or the individual tasks incorporated into other workflows.
The class structure is:
BandStackWorkflowwhich extendsdatacube.api.workflow.cell_dataset_band.WorkflowBandStackSummaryTaskwhich extendsdatacube.api.workflow.cell_dataset_band.SummaryTaskBandStackCellTaskwhich extendsdatacube.api.workflow.cell_dataset_band.CellTaskBandStackCellDatasetBandTaskwhich extendsdatacube.api.workflow.cell_dataset_band.CellDatasetBandTask
It can be run as:
$ band_stack.py --x-min 120 --x-max 120 --y-min -20 --y-max -20 --satellite LS5 LS7 LS8 --acq-min 2013-12 --acq-max 2013-12 --dataset-type ARG25 --mask-pqa-apply --output-directory /tmp --local-scheduler --workers 16 --output-format ENVI
which produces:
$ ls -lh

-rw-r----- 1 sjo547 u46 153M May  5 10:13 LS578_NBAR_WITH_PQA_STACK_BLUE_120_-020_2013_12_01_2013_12_31.dat
-rw-r----- 1 sjo547 u46  775 May  5 10:13 LS578_NBAR_WITH_PQA_STACK_BLUE_120_-020_2013_12_01_2013_12_31.hdr

-rw-r----- 1 sjo547 u46  92M May  5 10:13 LS578_NBAR_WITH_PQA_STACK_COASTAL_AEROSOL_120_-020_2013_12_01_2013_12_31.dat
-rw-r----- 1 sjo547 u46  694 May  5 10:13 LS578_NBAR_WITH_PQA_STACK_COASTAL_AEROSOL_120_-020_2013_12_01_2013_12_31.hdr

-rw-r----- 1 sjo547 u46 153M May  5 10:13 LS578_NBAR_WITH_PQA_STACK_GREEN_120_-020_2013_12_01_2013_12_31.dat
-rw-r----- 1 sjo547 u46  776 May  5 10:13 LS578_NBAR_WITH_PQA_STACK_GREEN_120_-020_2013_12_01_2013_12_31.hdr

-rw-r----- 1 sjo547 u46 153M May  5 10:13 LS578_NBAR_WITH_PQA_STACK_NEAR_INFRARED_120_-020_2013_12_01_2013_12_31.dat
-rw-r----- 1 sjo547 u46  784 May  5 10:13 LS578_NBAR_WITH_PQA_STACK_NEAR_INFRARED_120_-020_2013_12_01_2013_12_31.hdr

-rw-r----- 1 sjo547 u46 153M May  5 10:13 LS578_NBAR_WITH_PQA_STACK_RED_120_-020_2013_12_01_2013_12_31.dat
-rw-r----- 1 sjo547 u46  774 May  5 10:13 LS578_NBAR_WITH_PQA_STACK_RED_120_-020_2013_12_01_2013_12_31.hdr

-rw-r----- 1 sjo547 u46 153M May  5 10:13 LS578_NBAR_WITH_PQA_STACK_SHORT_WAVE_INFRARED_1_120_-020_2013_12_01_2013_12_31.dat
-rw-r----- 1 sjo547 u46  792 May  5 10:13 LS578_NBAR_WITH_PQA_STACK_SHORT_WAVE_INFRARED_1_120_-020_2013_12_01_2013_12_31.hdr

-rw-r----- 1 sjo547 u46 153M May  5 10:13 LS578_NBAR_WITH_PQA_STACK_SHORT_WAVE_INFRARED_2_120_-020_2013_12_01_2013_12_31.dat
-rw-r----- 1 sjo547 u46  792 May  5 10:13 LS578_NBAR_WITH_PQA_STACK_SHORT_WAVE_INFRARED_2_120_-020_2013_12_01_2013_12_31.hdr

-rw-r----- 1 sjo547 u46  92M May  5 10:10 LS8_FC_WITH_PQA_STACK_BARE_SOIL_120_-020_2013_12_01_2013_12_31.dat
-rw-r----- 1 sjo547 u46  662 May  5 10:10 LS8_FC_WITH_PQA_STACK_BARE_SOIL_120_-020_2013_12_01_2013_12_31.hdr

-rw-r----- 1 sjo547 u46  92M May  5 10:10 LS8_FC_WITH_PQA_STACK_NON_PHOTOSYNTHETIC_VEGETATION_120_-020_2013_12_01_2013_12_31.dat
-rw-r----- 1 sjo547 u46  682 May  5 10:10 LS8_FC_WITH_PQA_STACK_NON_PHOTOSYNTHETIC_VEGETATION_120_-020_2013_12_01_2013_12_31.hdr

-rw-r----- 1 sjo547 u46  92M May  5 10:10 LS8_FC_WITH_PQA_STACK_PHOTOSYNTHETIC_VEGETATION_120_-020_2013_12_01_2013_12_31.dat
-rw-r----- 1 sjo547 u46  678 May  5 10:10 LS8_FC_WITH_PQA_STACK_PHOTOSYNTHETIC_VEGETATION_120_-020_2013_12_01_2013_12_31.hdr

-rw-r----- 1 sjo547 u46  92M May  5 10:10 LS8_FC_WITH_PQA_STACK_UNMIXING_ERROR_120_-020_2013_12_01_2013_12_31.dat
-rw-r----- 1 sjo547 u46  667 May  5 10:10 LS8_FC_WITH_PQA_STACK_UNMIXING_ERROR_120_-020_2013_12_01_2013_12_31.hdr
If incorporating it into other workflows you would yield/return in your workflow a BandStackCellTask task something like:
BandStackCellTask(x=120, y=-20,
                  acq_min=datetime(2014, 12, 1), acq_max=datetime(2014, 12, 31),
                  satellites=[Satellite.LS5, Satellite.LS7, Satellite.LS8],
                  output_directory="/tmp",
                  csv=False, dummy=False,
                  mask_pqa_apply=True, mask_pqa_mask=[PqaMask.PQ_MASK_CLEAR],
                  mask_wofs_apply=False, mask_wofs_mask=None,
                  dataset_type=[DatasetType.ARG25], bands=BandListType.COMMON, output_format=OutputFormat.ENVI)
Other Workflows
There are also “chunk” workflows that have all the logic for splitting a cell (or a dataset or a …) up into manageable chunks.
For e.g. for doing full time series depth statistics.
Etc…
More info coming soon