Compare to Ground Gravity
Airborne gravity test lines are flown to allow comparison with ground gravity. When making such comparisons, it is useful to know the sampling and quality of the ground gravity and, in Australia, this can be assessed by plotLinesOnGroundStns.
We access the Canobie data for an example data set.
from pathlib import Path
import galileoQC as qc

data_root = r'./CanobieData/'
canobieHDF_file = Path(r'./CanobieData/Canobie.hdf5')
We need to know the line number of at least one line, so here we report all the line numbers so that we can select one.
qc.reportLines(canobieHDF_file)
---------------------------------------------------------------------------
FileNotFoundError                         Traceback (most recent call last)
Cell In[2], line 1
----> 1 qc.reportLines(canobieHDF_file)

File ~/.local/lib/python3.12/site-packages/galileoQC/whizzFiles/reportData.py:116, in reportLines(whizzFile)
    100 """
    101 Prints a short summary of the flight-lines in a HDF5 Whizz file.
    102
   (...)    112
    113 """
    114 filename = str(whizzFile)
--> 116 oddlines, evenlines = _getOddEvenLines(whizzFile)
    117 travlines, ctrllines = _getTravCtrlLines(whizzFile)
    118 plandlines, unplandlines = _getPlannedLines(whizzFile)

File ~/.local/lib/python3.12/site-packages/galileoQC/gridFiles/oddeven.py:352, in _getOddEvenLines(whizz_file)
    349 numodds = 0
    350 oddlines = []
--> 352 with h5py.File(filename, 'r') as f:
    353     lines_group = f[groupName]['Lines']
    354     lines = lines_group.keys()

File ~/.local/lib/python3.12/site-packages/h5py/_hl/files.py:555, in File.__init__(self, name, mode, driver, libver, userblock_size, swmr, rdcc_nslots, rdcc_nbytes, rdcc_w0, track_order, fs_strategy, fs_persist, fs_threshold, fs_page_size, page_buf_size, min_meta_keep, min_raw_keep, locking, alignment_threshold, alignment_interval, meta_block_size, track_times, **kwds)
    546     fapl = make_fapl(driver, libver, rdcc_nslots, rdcc_nbytes, rdcc_w0,
    547                      locking, page_buf_size, min_meta_keep, min_raw_keep,
    548                      alignment_threshold=alignment_threshold,
    549                      alignment_interval=alignment_interval,
    550                      meta_block_size=meta_block_size,
    551                      **kwds)
    552     fcpl = make_fcpl(track_order=track_order, track_times=track_times,
    553                      fs_strategy=fs_strategy, fs_persist=fs_persist,
    554                      fs_threshold=fs_threshold, fs_page_size=fs_page_size)
--> 555     fid = make_fid(name, mode, userblock_size, fapl, fcpl, swmr=swmr)
    557 if isinstance(libver, tuple):
    558     self._libver = libver

File ~/.local/lib/python3.12/site-packages/h5py/_hl/files.py:232, in make_fid(name, mode, userblock_size, fapl, fcpl, swmr)
    230     if swmr:
    231         flags |= h5f.ACC_SWMR_READ
--> 232     fid = h5f.open(name, flags, fapl=fapl)
    233 elif mode == 'r+':
    234     fid = h5f.open(name, h5f.ACC_RDWR, fapl=fapl)

File h5py/_objects.pyx:54, in h5py._objects.with_phil.wrapper()
---> 54 'Could not get source, probably due dynamically evaluated source code.'

File h5py/_objects.pyx:55, in h5py._objects.with_phil.wrapper()
---> 55 'Could not get source, probably due dynamically evaluated source code.'

File h5py/h5f.pyx:106, in h5py.h5f.open()
--> 106 'Could not get source, probably due dynamically evaluated source code.'

FileNotFoundError: [Errno 2] Unable to synchronously open file (unable to open file: name = 'CanobieData/Canobie.hdf5', errno = 2, error message = 'No such file or directory', flags = 0, o_flags = 0)
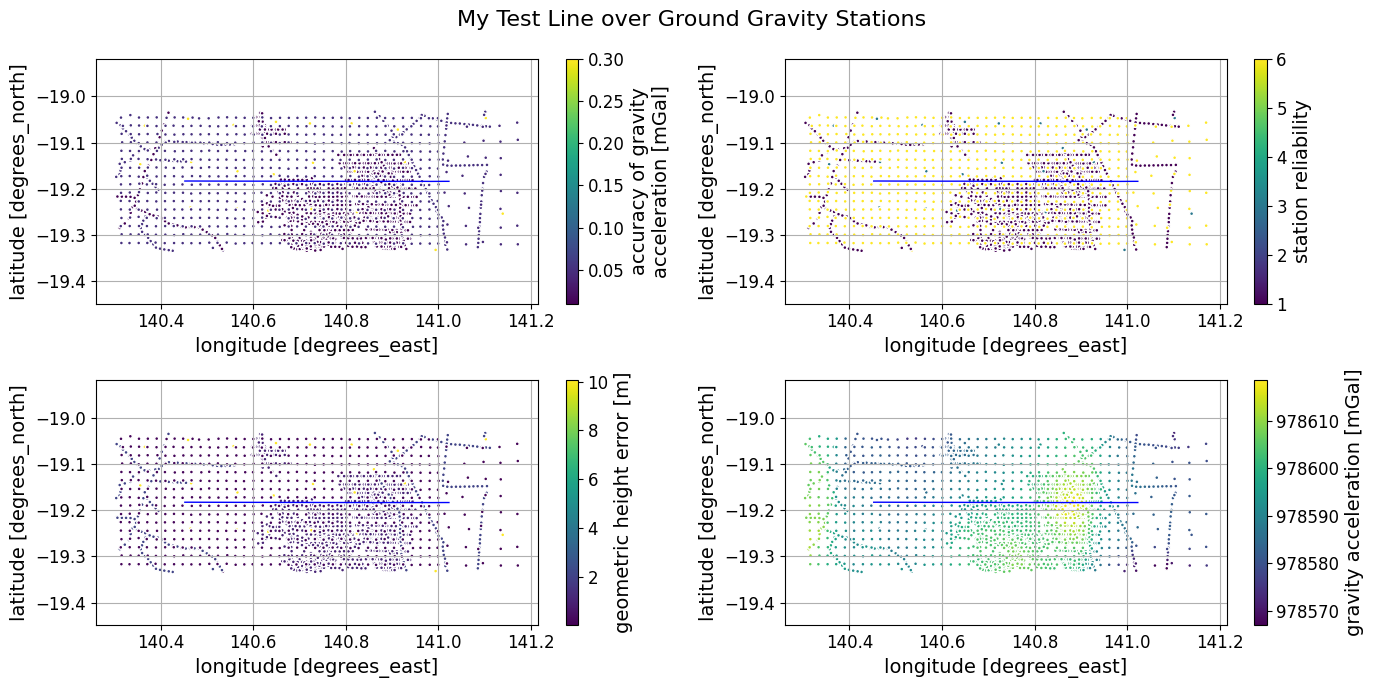
And now we plot our flight-line over scatter plots of the ground gravity, and its accuracy, station reliability, and height error. The data are read from the Geoscience Australia site via pooch.
In this case, gravity accuracy is rated pretty good and height errors small; The data in dark colours (upper right plot) are of poor reliability; these look to be from some small exploration surveys and some data collected along roads. The regularly spaced gravity (yellow dots) are rated of high reliability.
Overall, it seems that the ground gravity data here are pretty good.
qc.plotLinesOnGroundStns(canobieHDF_file, '100020.000',
	fig_title='My Test Line over Ground Gravity Stations')