An Example
Input
Input DEM:
jerram_dem: Esri Grid format, MGA 50, 25 m resolution. See Fig. 10 The input DEM is located under the examples\input folder.
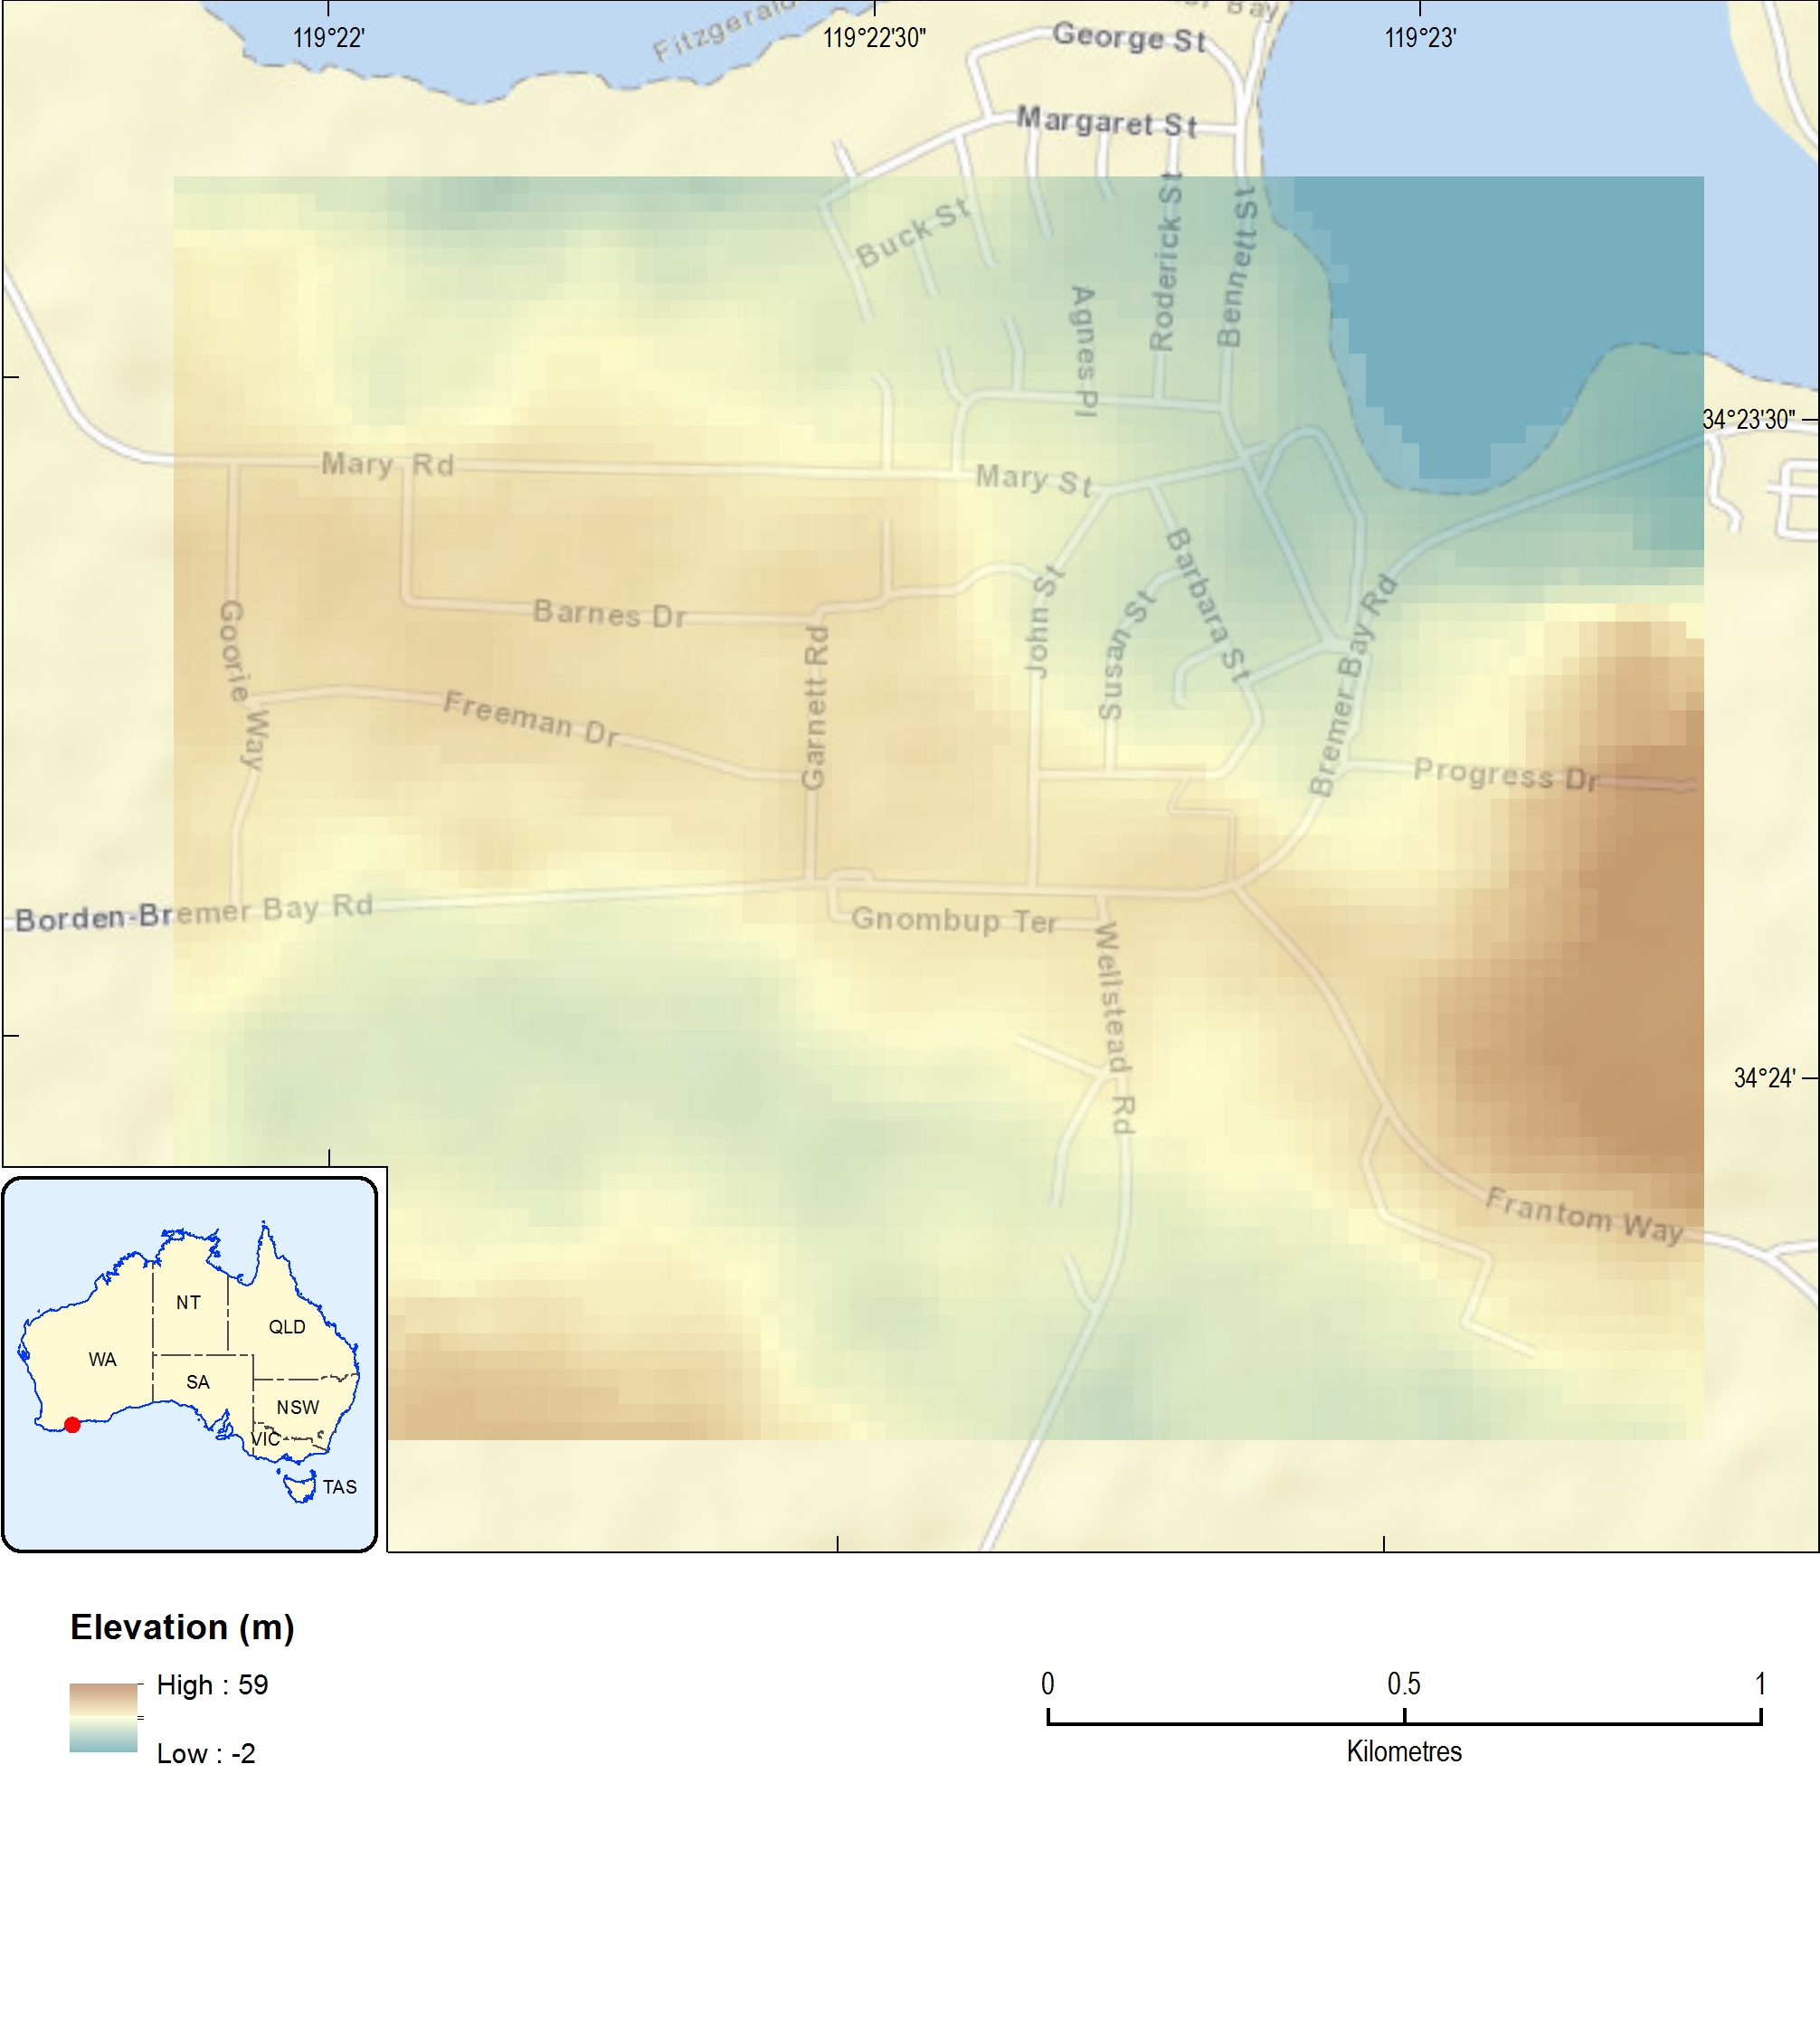
Fig. 10 Example DEM data at Jerramungup, WA.
Input vegetation:
jerram_veg: Esri Grid format, GDA 1994 Australia Albers, 100 m resolution. See Fig. 11. The input vegetation dataset is located under the examples\input folder.
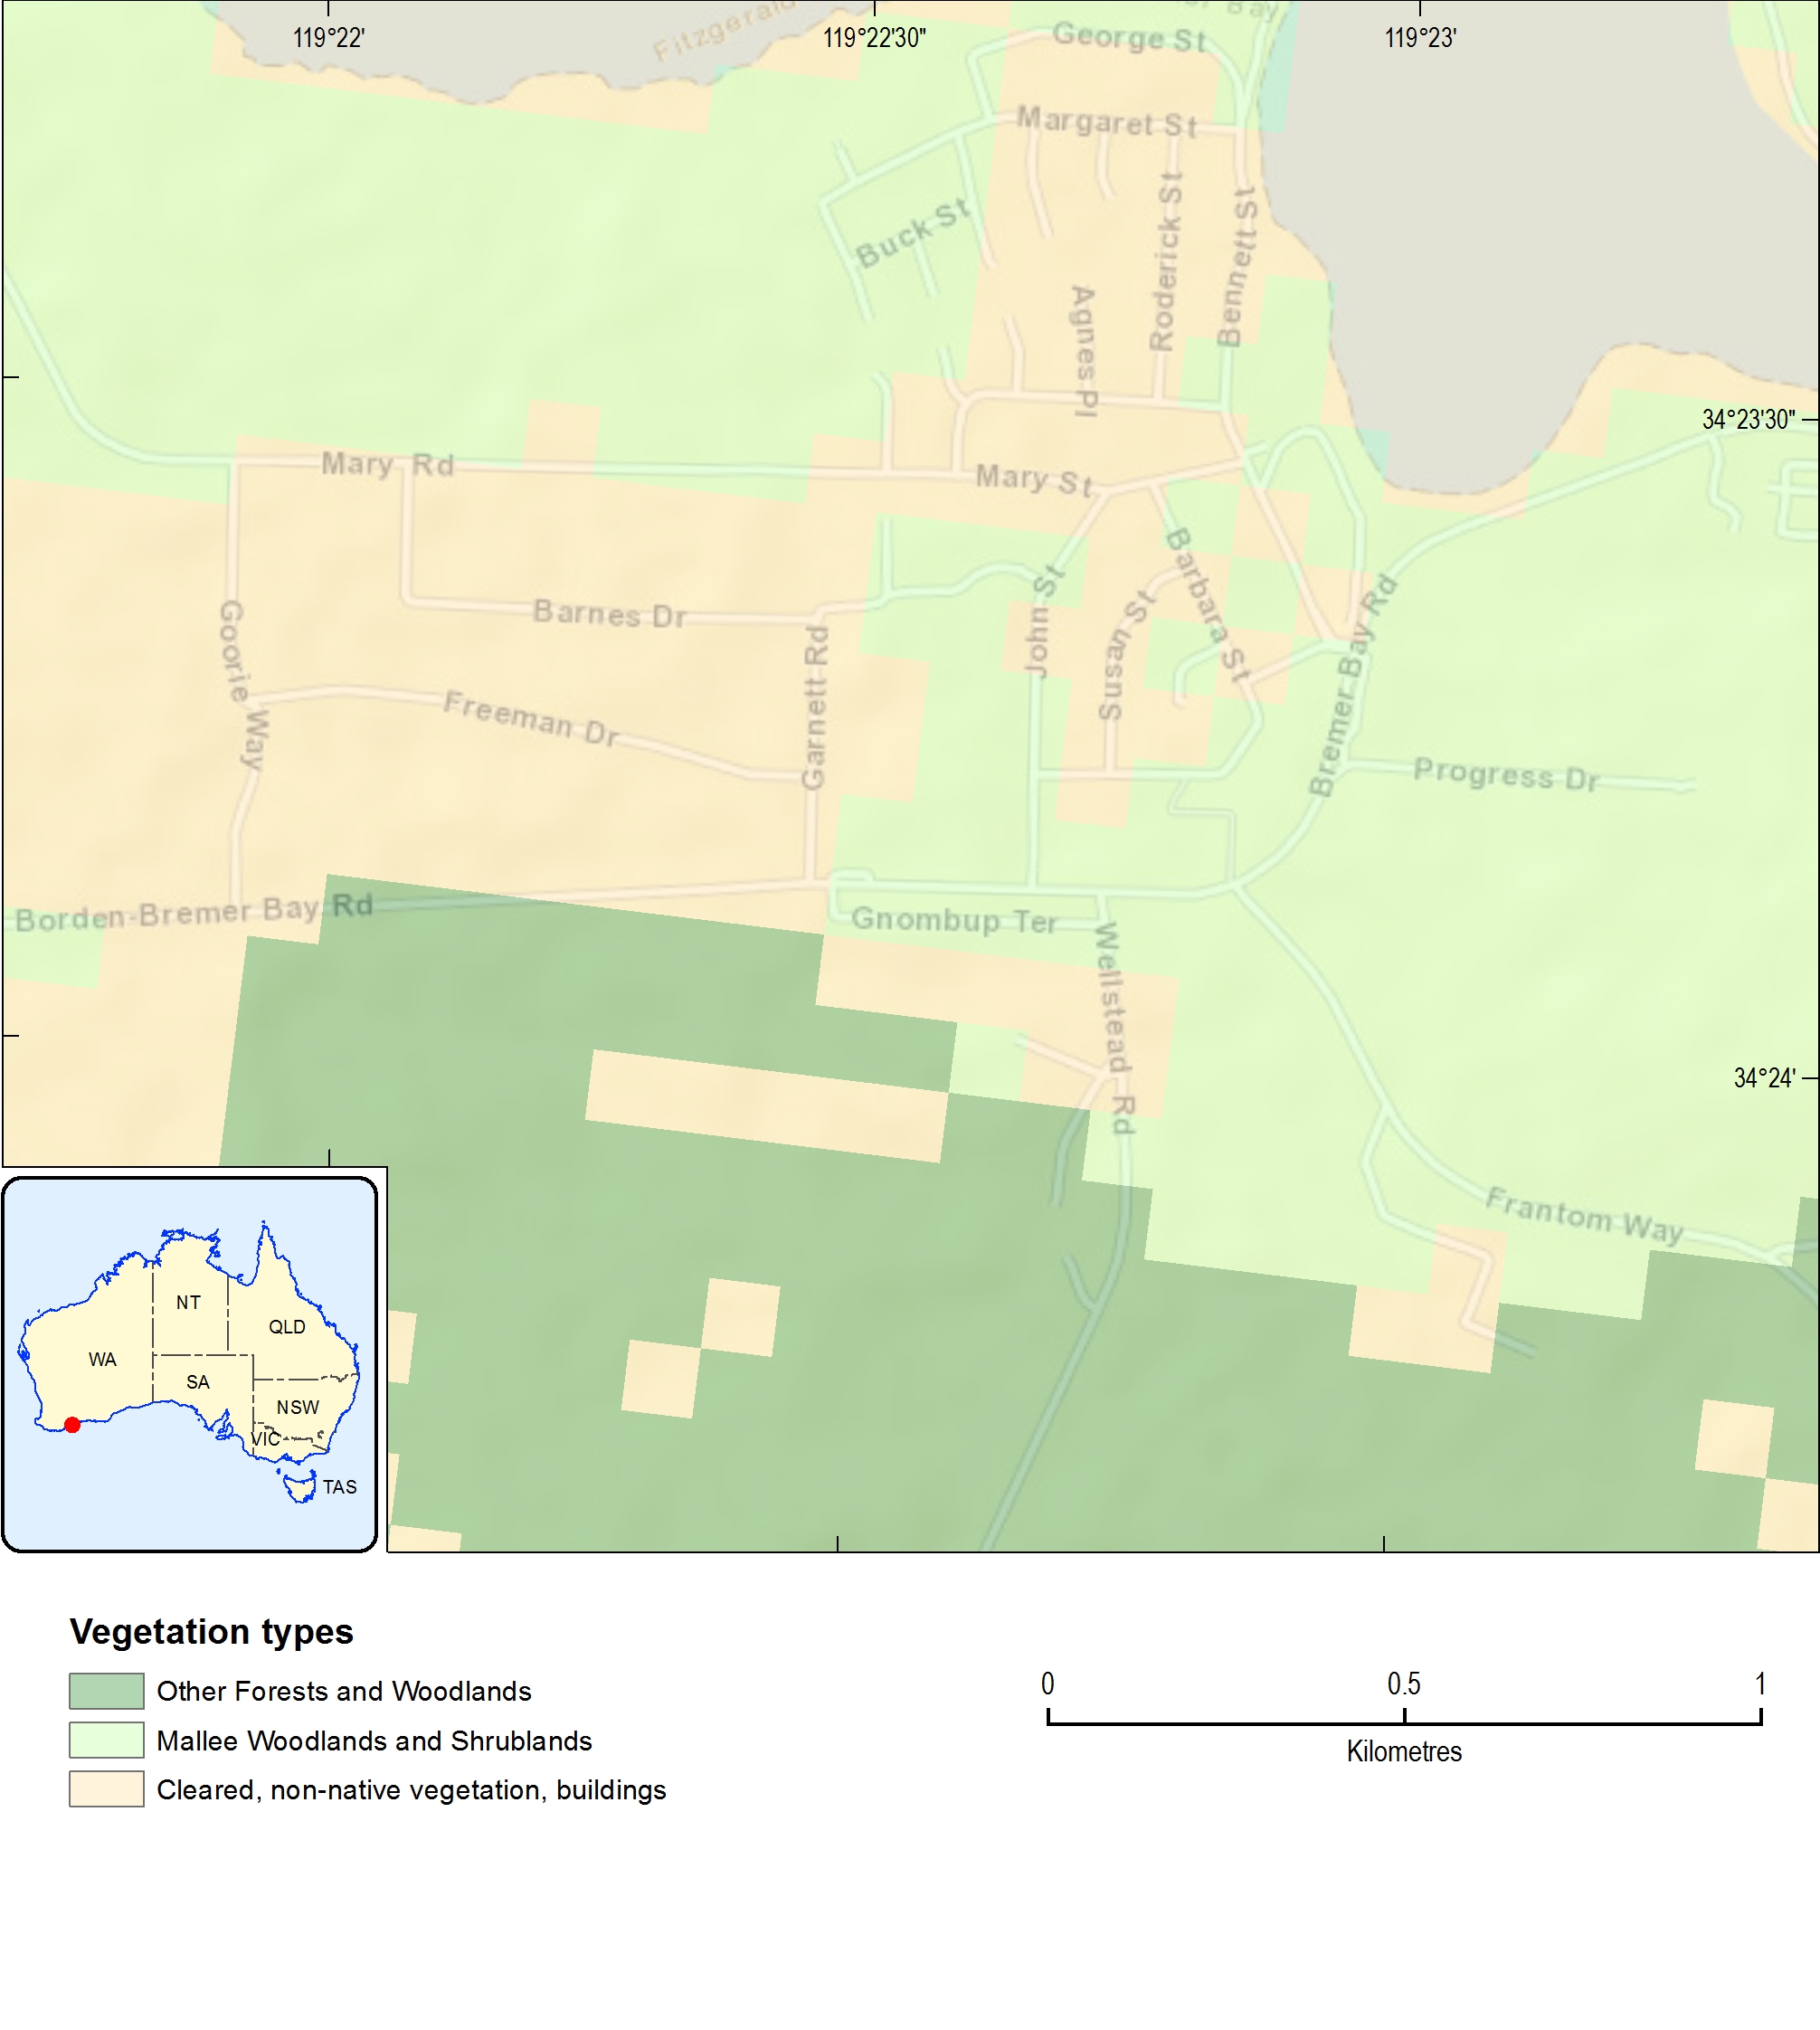
Fig. 11 Example vegetation data at Jerramungup, WA.
Input vegetation reclassification map:
There are many classes in the original vegetation. To derive the target vegetation classes described in the Standard (1: Forest, 2: Woodland, 3: Shrubland, 4: Scrub, 5: Mallee/Mulga, 6: Rainforest, 7: Grassland/Tussock moorland.), the remap string is defined as: “1 6;2 1;3 1;4 1;5 13 2;14 5;15 18 3;19 22 7;23 4;24 25 NODATA;26 4;27 28 NODATA;29 4;30 1;31 2;32 5;99 NODATA”.
Output path:
The example output path is C:\github\bal\examples\output.
FDI value:
Default value 80 is selected.
Extent:
Default is selected.
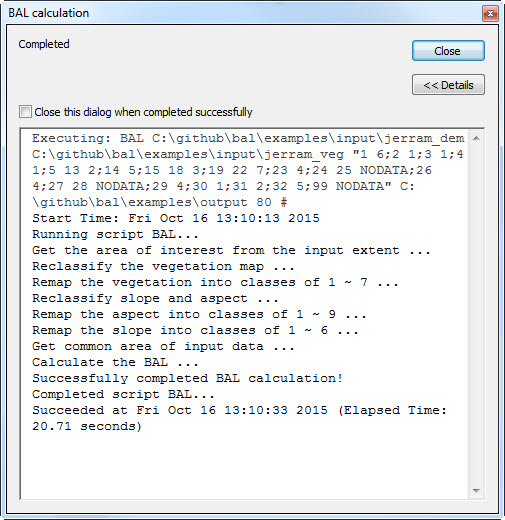
After all input parameters are defined, the fields in the BAL calculation window are all populated. See Fig. 12.
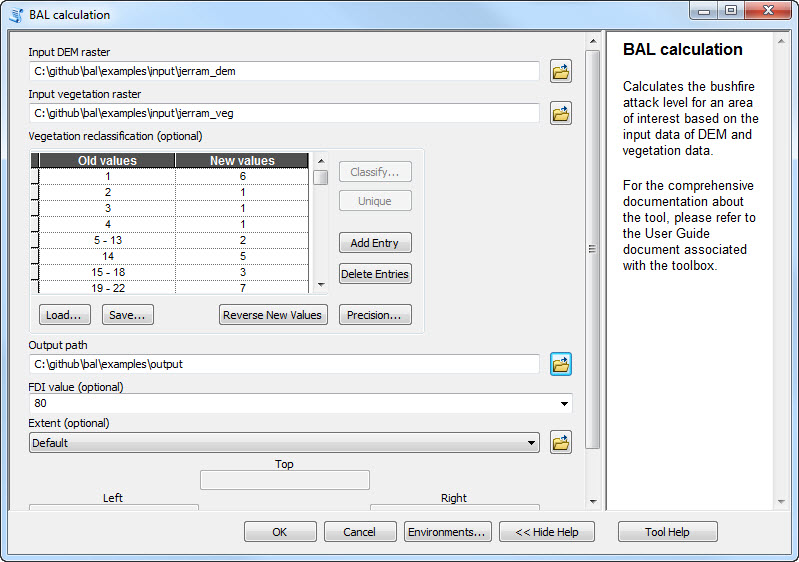
Fig. 12 Figure 6.3 Example input parameters within BAL calculation window.